Recommended setting for data visualisation animations in Tableau workbooks and guidance for how and when to change them.
What are visualisation animations?
Visualisation animations are when the graph or table shifts in a visible way when filters are amended or data is altered by the user when interacting with a dashboard.
Advantages:
It can look sleek and professional
It makes it very clear when filters have been amended / data in the visualisation has changed as users can physically see the process of the data changing
Negatives:
It take more processing power and can be slow
It’s less sleek when processing a lot of data
What is the default setting and why?
Reports default setting should be to have animations turned off. This is to improve the speed and responsiveness of the report for all users.
To check visualisation are off, using the main Tableau menu click Formatting > Animations to see the animations pane appear:
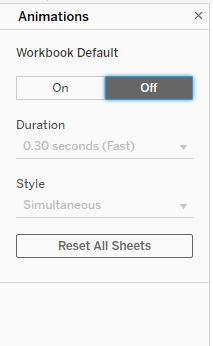
It should show ‘Off’ to be selected.
Conditions for changing the default setting
If you have a graph that would specifically benefit from animation - this can be enabled on a sheet by sheet basis.
How to change the default setting
Either click on the visualisation within it’s dashboard or navigate to the specific sheet you want to enable animations on.
With the visualisation selected click Formatting > Animations in the main menu.
As you’ve highlighted a specific visualisation the animations pane will now contain an extended set of options. Leave the workbook default set to off and see the sheet settings below:
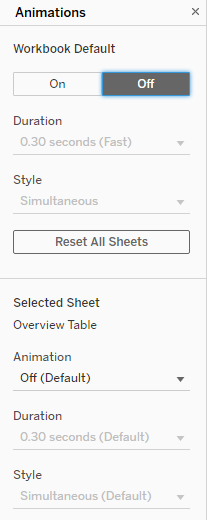
From this menu you can select the sheet you wish to animate and dictate the animation settings.